
If you’re working with NVIDIA GPUs whether for deep learning, HPC, or systems administration you’ve likely used the default nvidia-smi tool to check GPU status. But what if you want something more dynamic, interactive, and user-friendly? Enter nvitop, an incredible interactive NVIDIA GPU process viewer that makes monitoring your GPUs intuitive and informative.

nvitop is a Python-based GPU monitoring tool that extends and enriches what nvidia-smi does with live updates, color coding, interactive filtering, and more. It’s perfect for developers, engineers, researchers, and admins who need real-time insight into how GPU resources are being used.
What Makes nvitop Different?
Unlike nvidia-smi, which outputs a static snapshot, nvitop offers a fundamentally different experience:
- Interactive Real-Time Monitoring — Runs as a live monitor that refreshes continuously, similar to
htopfor CPUs - Color-Coded Output — Intuitive visuals make it easy to spot heavy GPU usage and memory pressure at a glance
- Process Management — Sort, filter, and manage processes directly with keyboard controls
- Rich Data Display — GPU metrics including utilization, memory, temperature, power, and processes in a compact, organized view
- Cross-Platform — Works on both Linux and Windows
Side-by-Side Comparison with nvidia-smi
The difference becomes immediately apparent when you compare nvitop’s output with the traditional nvidia-smi tool:

Installation
Installing nvitop is straightforward. If you have Python installed, you can use pip:
pip install --upgrade nvitopOr, if you prefer conda:
conda install -c conda-forge nvitopFor isolated environments using uvx or pipx:
uvx nvitop
# or
pipx run nvitop
Once installed, simply run:
nvitopThis launches the interactive monitor showing your NVIDIA GPUs, their current utilization, and the processes using them — all updating live.
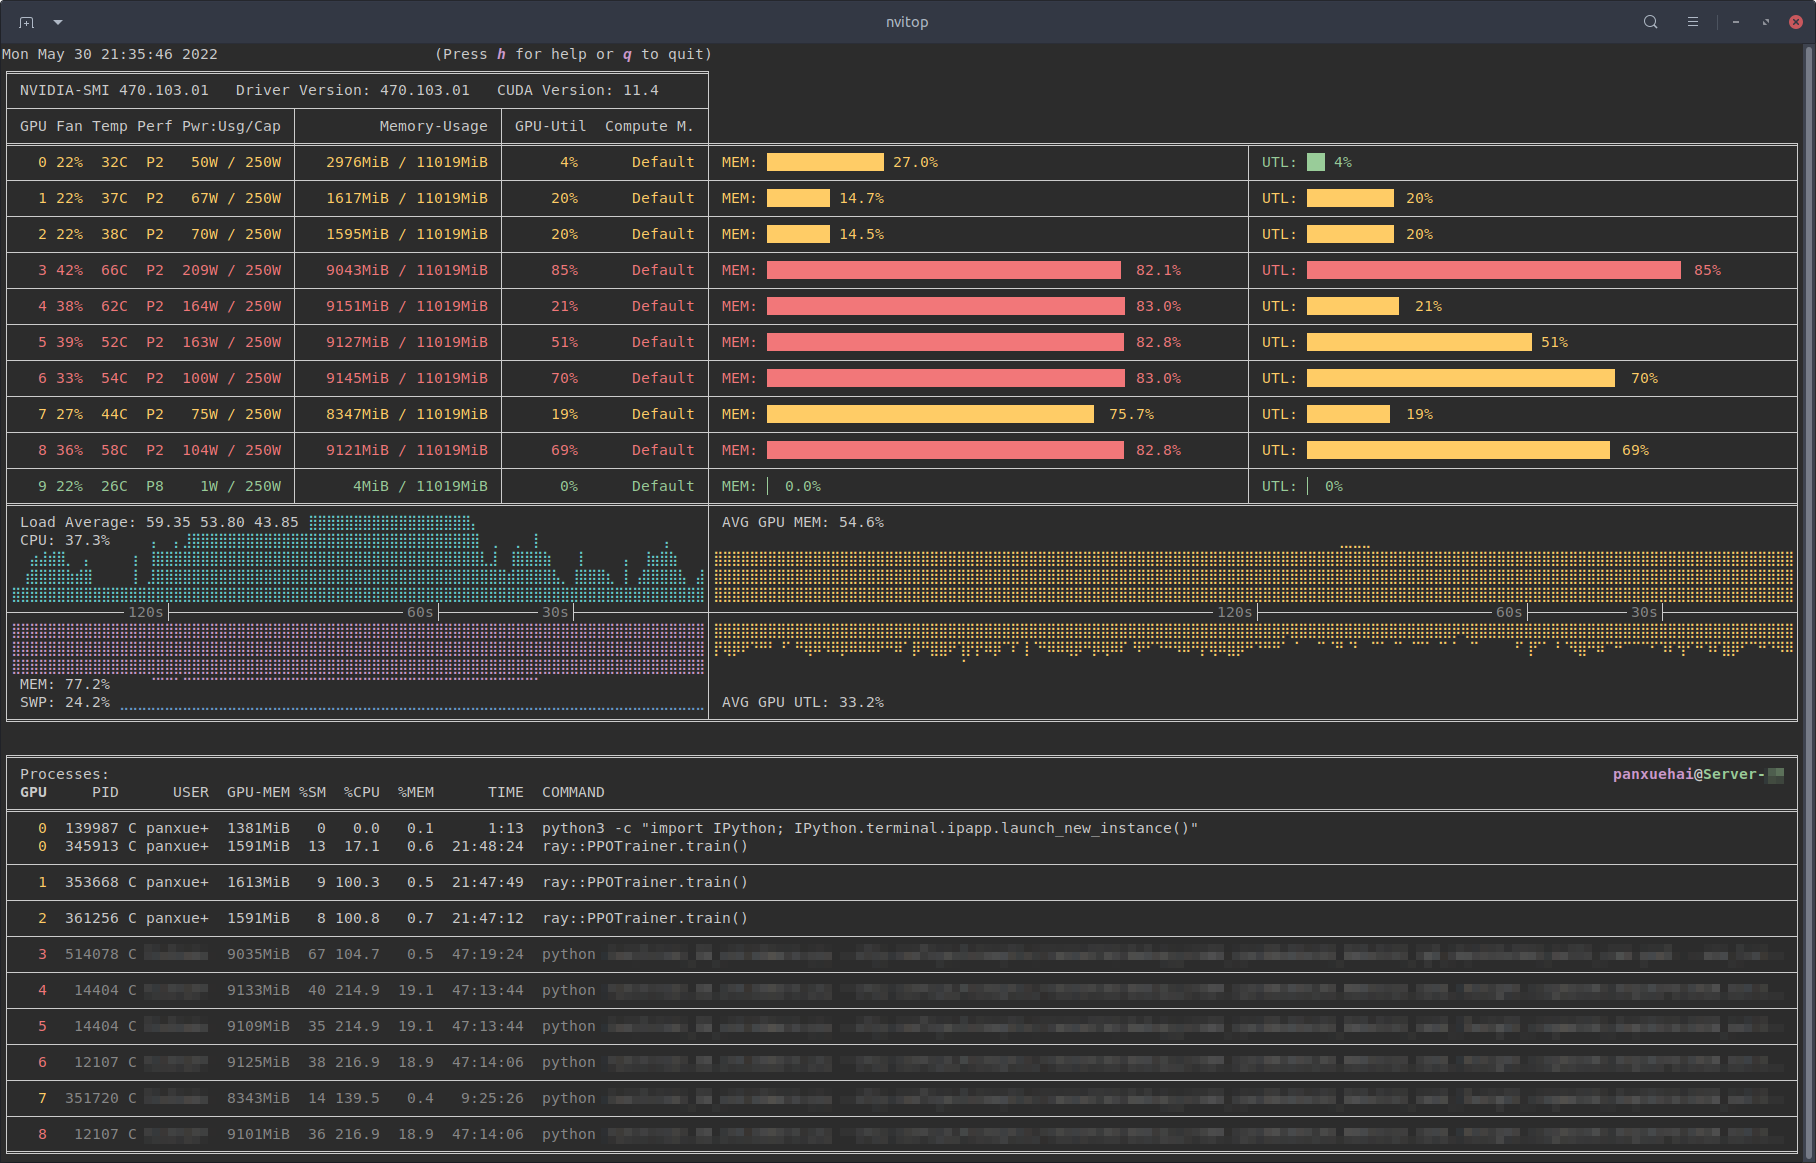
What You’ll See
Running nvitop in your terminal displays a live dashboard with comprehensive GPU stats:
- GPU temperature and fan speed
- Memory usage with bar charts
- GPU and memory utilization percentages
- Power consumption
- Process list with GPU memory and compute usage per process
- History graphs for utilization trends
It’s like combining the best of nvidia-smi, top, and htop — but specifically designed for your GPUs.

Process Metrics and Management
One of nvitop’s standout features is the ability to dive deep into individual process metrics. Select a process and press Enter to see detailed live graphs:

You can also manage processes directly from the interface:
- Ctrl+C or I — Send interrupt signal (SIGINT)
- T — Terminate process (SIGTERM)
- K — Kill process (SIGKILL)
- t — Toggle tree-view to see process hierarchies
- e — View environment variables
Windows Support
Unlike many GPU monitoring tools that are Linux-only, nvitop works natively on Windows as well:

Built-in Help
Press h at any time to access the comprehensive help screen with all available keybindings:

Why This Matters
Real-time GPU visibility is crucial in many modern workloads:
- Deep Learning Training — See which models or data pipelines are consuming your GPU resources and identify bottlenecks
- HPC / Multi-User Servers — Quickly identify who is using GPUs and how much, essential for shared compute environments
- Debugging — Spot processes consuming excessive memory or identify stuck jobs that need intervention
- DevOps Monitoring — Integrate with larger monitoring stacks using nvitop’s Python API or the new nvitop-exporter for Grafana dashboards
Key Features Summary
| Feature | Description |
|---|---|
| Live Monitoring | Continuous updates with configurable refresh intervals |
| Process Management | Kill, terminate, or interrupt processes directly |
| Tree View | See process hierarchies and parent relationships |
| Device Selection | Includes nvisel tool for CUDA device selection |
| Python API | Full programmatic access for custom monitoring tools |
| MIG Support | Works with NVIDIA Multi-Instance GPU configurations |
| Grafana Integration | Export metrics via nvitop-exporter for dashboards |
Common Usage Examples
# Basic monitoring (auto display mode)
nvitop

# One-shot query (like nvidia-smi)
nvitop -1

# Full display mode
nvitop -m full

# Compact display mode
nvitop -m compact

# Only show specific GPUs
nvitop -o 0 1

# Only show CUDA visible devices
nvitop -ov

# Colorful spectrum-like bar charts
nvitop --colorful

# For light terminal themes
nvitop --light
Summary
If you’re into HPC and GPU diagnostics, this is a cool tool to learn and play with. Nick Tailor tech choice award for sure.
Check out the official repository on GitHub: https://github.com/XuehaiPan/nvitop
Full API documentation is available at: https://nvitop.readthedocs.io