
Author: admin
How to Deploy a Node.js App to Azure App Service with CI/CD
Option A: Code-Based Deployment (Recommended for Most Users)
If you don’t need a custom runtime or container, Azure’s built-in code deployment option is the fastest and easiest way to host production-ready Node.js applications. Azure provides a managed environment with runtime support for Node.js, and you can automate everything using Azure DevOps.
This option is ideal for most production use cases that:
- Use standard versions of Node.js (or Python, .NET, PHP)
- Don’t require custom OS packages or NGINX proxies
- Want quick setup and managed scaling
This section covers everything you need to deploy your Node.js app using Azure’s built-in runtime and set it up for CI/CD in Azure DevOps.
Step 0: Prerequisites and Permissions
Before starting, make sure you have the following:
- Azure Subscription with Contributor access
- Azure CLI installed and authenticated (
az login) - Azure DevOps Organization & Project
- Code repository in Azure Repos or GitHub (we’ll use Azure Repos)
- A user with the following roles:
- Contributor on the Azure resource group
- Project Administrator or Build Administrator in Azure DevOps (to create pipelines and service connections)
Step 1: Create an Azure Resource Group
az group create --name prod-rg --location eastusStep 2: Choose Your Deployment Model
There are two main ways to deploy to Azure App Service:
- Code-based: Azure manages the runtime (Node.js, Python, etc.)
- Docker-based: You provide a custom Docker image
Option A: Code-Based App Service Plan
az appservice plan create \
  --name prod-app-plan \
  --resource-group prod-rg \
  --sku P1V2 \
  --is-linux
az appservice plan create: Command to create a new App Service Plan (defines compute resources)--name prod-app-plan: The name of the service plan to create--resource-group prod-rg: The name of the resource group where the plan will reside--sku P1V2: The pricing tier (Premium V2, small instance). Includes autoscaling, staging slots, etc.--is-linux: Specifies the operating system for the app as Linux (required for Node.js apps)
Create Web App with Built-In Node Runtime
az webapp create \
  --name my-prod-node-app \
  --resource-group prod-rg \
  --plan prod-app-plan \
  --runtime "NODE|18-lts"
az webapp create: Creates the actual web app that will host your code--name my-prod-node-app: The globally unique name of your app (will be part of the public URL)--resource-group prod-rg: Assigns the app to the specified resource group--plan prod-app-plan: Binds the app to the previously created compute plan--runtime "NODE|18-lts": Specifies the Node.js runtime version (Node 18, LTS channel)
Option B: Docker-Based App Service Plan
az appservice plan create \
  --name prod-docker-plan \
  --resource-group prod-rg \
  --sku P1V2 \
--is-linux- Same as Option A — this creates a Linux-based Premium plan
- You can reuse this compute plan for one or more container-based apps
Create Web App Using Custom Docker Image
az webapp create \
  --name my-docker-app \
  --resource-group prod-rg \
  --plan prod-docker-plan \
  --deployment-container-image-name myregistry.azurecr.io/myapp:latest
--name my-docker-app: A unique name for your app--resource-group prod-rg: Associates this web app with your resource group--plan prod-docker-plan: Assigns the app to your App Service Plan--deployment-container-image-name: Specifies the full path to your Docker image (from ACR or Docker Hub)
Use this if you’re building a containerized app and want full control of the runtime environment. Make sure your image is accessible in Azure Container Registry or Docker Hub.
Step 3: Prepare Your Azure DevOps Project
- Navigate to https://dev.azure.com
- Create a new Project (e.g.,
ProdWebApp) - Go to Repos and push your Node.js code:
git remote add origin https://dev.azure.com/<org>/<project>/_git/my-prod-node-app
git push -u origin main
Step 4: Create a Service Connection
- In DevOps, go to Project Settings > Service connections
- Click New service connection > Azure Resource Manager
- Choose Service principal (automatic)
- Select the correct subscription and resource group
- Name it something like
AzureProdConnection
Step 5: Create the CI/CD Pipeline
Add the following to your repository root as .azure-pipelines.yml.
Code-Based YAML Example
trigger:
  branches:
    include:
      - main

pool:
  vmImage: 'ubuntu-latest'

stages:
- stage: Build
  jobs:
  - job: BuildApp
    steps:
    - task: NodeTool@0
      inputs:
        versionSpec: '18.x'

    - script: |
        npm install
        npm run build
      displayName: 'Install and Build'

    - task: ArchiveFiles@2
      inputs:
        rootFolderOrFile: '$(System.DefaultWorkingDirectory)'
        archiveFile: '$(Build.ArtifactStagingDirectory)/app.zip'
        includeRootFolder: false

    - task: PublishBuildArtifacts@1
      inputs:
        PathtoPublish: '$(Build.ArtifactStagingDirectory)'
        ArtifactName: 'drop'

- stage: Deploy
  dependsOn: Build
  jobs:
  - deployment: DeployWebApp
    environment: 'production'
    strategy:
      runOnce:
        deploy:
          steps:
          - task: AzureWebApp@1
            inputs:
              azureSubscription: 'AzureProdConnection'
              appName: 'my-prod-node-app'
              package: '$(Pipeline.Workspace)/drop/app.zip'
Docker-Based YAML Example
trigger:
  branches:
    include:
      - main

pool:
  vmImage: 'ubuntu-latest'

stages:
- stage: Deploy
  jobs:
  - deployment: DeployContainer
    environment: 'production'
    strategy:
      runOnce:
        deploy:
          steps:
          - task: AzureWebAppContainer@1
            inputs:
              azureSubscription: 'AzureProdConnection'
              appName: 'my-docker-app'
              containers: 'myregistry.azurecr.io/myapp:latest'
Step 6: Configure Pipeline and Approvals
- Go to Pipelines > Pipelines > New
- Select Azure Repos Git, choose your repo, and point to the YAML file
- Click Run Pipeline
To add manual approvals:
- Go to Pipelines > Environments
- Create a new environment named
production - Link the deploy stage to this environment in your YAML:
environment: 'production'- Enable approval and checks for production safety
Step 7: Store Secrets (Optional but Recommended)
- Go to Pipelines > Library
- Create a new Variable Group (e.g.,
ProdSecrets) - Add variables like
DB_PASSWORD,API_KEY, and mark them as secret - Reference them in pipeline YAML:
variables:
  - group: 'ProdSecrets'
Troubleshooting Tips
| Problem | Solution |
|---|---|
| Resource group not found | Make sure you created it with az group create |
| Runtime version not supported | Run az webapp list-runtimes --os linux to see current options |
| Pipeline can’t deploy | Check if the service connection has Contributor role on the resource group |
| Build fails | Make sure you have a valid package.json and build script |
Summary
By the end of this process, you will have:
- A production-grade Node.js app running on Azure App Service
- A scalable App Service Plan using Linux and Premium V2 resources
- A secure CI/CD pipeline that automatically builds and deploys from Azure Repos
- Manual approval gates and secrets management for enhanced safety
- The option to deploy using either Azure-managed runtimes or fully custom Docker containers
This setup is ideal for fast-moving
How to Deploy a Custom Rocky Linux Image in Azure with cloud-init
Need a clean, hardened Rocky Linux image in Azure — ready to go with your tools and configs? Here’s how to use Packer to build a Rocky image and then deploy it with cloud-init using Azure CLI.
Step 0: Install Azure CLI
Before deploying anything, make sure you have Azure CLI installed.
Linux/macOS:
curl -sL https://aka.ms/InstallAzureCLIDeb | sudo bashWindows:
Download and install from https://aka.ms/installazurecli
Login:
az loginThis opens a browser window for authentication. Once done, you’re ready to deploy.
Step 1: Build a Custom Image with Packer
Create a Packer template with Azure as the target and make sure cloud-init is installed during provisioning.
Packer Template Example (rocky-azure.pkr.hcl):
source "azure-arm" "rocky" {
  client_id       = var.client_id
  client_secret   = var.client_secret
  tenant_id       = var.tenant_id
  subscription_id = var.subscription_id

  managed_image_resource_group_name = "packer-images"
  managed_image_name                = "rocky-image"
  location                          = "East US"
  os_type                           = "Linux"
  image_publisher                   = "OpenLogic"
  image_offer                       = "CentOS"
  image_sku                         = "8_2"
  vm_size                           = "Standard_B1s"
  build_resource_group_name         = "packer-temp"
}

build {
  sources = ["source.azure-arm.rocky"]

  provisioner "shell" {
    inline = [
      "dnf install -y cloud-init",
      "systemctl enable cloud-init"
    ]
  }
}
Variables File (variables.pkrvars.hcl):
client_id       = "xxxxxxxx-xxxx-xxxx-xxxx-xxxxxxxxxxxx"
client_secret   = "your-secret"
tenant_id       = "your-tenant-id"
subscription_id = "your-subscription-id"
Build the Image:
packer init .
packer build -var-file=variables.pkrvars.hcl .
Step 2: Prepare a Cloud-init Script
This will run the first time the VM boots and set things up.
cloud-init.yaml:
#cloud-config
hostname: rocky-demo
users:
  - name: devops
    sudo: ALL=(ALL) NOPASSWD:ALL
    groups: users, admin
    shell: /bin/bash
    ssh_authorized_keys:
      - ssh-rsa AAAA...your_key_here...

runcmd:
  - yum update -y
  - echo 'Cloud-init completed!' > /etc/motd
Step 3: Deploy the VM in Azure
Use the Azure CLI to deploy a VM from the managed image and inject the cloud-init file.
az vm create \
  --resource-group my-rg \
  --name rocky-vm \
  --image /subscriptions/<SUB_ID>/resourceGroups/packer-images/providers/Microsoft.Compute/images/rocky-image \
  --admin-username azureuser \
  --generate-ssh-keys \
  --custom-data cloud-init.yaml
Step 4: Verify Cloud-init Ran
ssh azureuser@<public-ip>
cat /etc/motd
You should see:
Cloud-init completed!Recap
- Install Azure CLI and authenticate with
az login - Packer creates a reusable Rocky image with
cloud-initpreinstalled - Cloud-init configures the VM at first boot using a YAML script
- Azure CLI deploys the VM and injects custom setup
By combining Packer and cloud-init, you ensure your Azure VMs are fast, consistent, and ready from the moment they boot.
Automate Rocky Linux Image Creation in Azure Using Packer
Spinning up clean, custom Rocky Linux VMs in Azure doesn’t have to involve manual configuration or portal clicks. With HashiCorp Packer, you can create, configure, and publish VM images to your Azure subscription automatically.
What You’ll Need
- Packer installed
- Azure CLI (
az login) - Azure subscription & resource group
- Azure Service Principal credentials
Step 1: Install Azure CLI
You need the Azure CLI to authenticate and manage resources.
On Linux/macOS:
curl -sL https://aka.ms/InstallAzureCLIDeb | sudo bashOn Windows:
Download and install from https://aka.ms/installazurecli
Step 2: Login to Azure
az loginThis will open a browser window for you to authenticate your account.
Step 3: Set the Default Subscription (if you have more than one)
az account set --subscription "SUBSCRIPTION_NAME_OR_ID"Step 4: Create a Resource Group for Images
az group create --name packer-images --location eastusStep 5: Create a Service Principal for Packer
az ad sp create-for-rbac \
  --role="Contributor" \
  --scopes="/subscriptions/<your-subscription-id>" \
  --name "packer-service-principal"
This will return the client_id, client_secret, tenant_id, and subscription_id needed for your variables file.
Step 6: Write the Packer Template (rocky-azure.pkr.hcl)
variable "client_id" {}
variable "client_secret" {}
variable "tenant_id" {}
variable "subscription_id" {}

source "azure-arm" "rocky" {
  client_id       = var.client_id
  client_secret   = var.client_secret
  tenant_id       = var.tenant_id
  subscription_id = var.subscription_id

  managed_image_resource_group_name = "packer-images"
  managed_image_name                = "rocky-image"

  os_type             = "Linux"
  image_publisher     = "OpenLogic"
  image_offer         = "CentOS"
  image_sku           = "8_2"
  location            = "East US"
  vm_size             = "Standard_B1s"

  capture_container_name    = "images"
  capture_name_prefix       = "rocky-linux"
  build_resource_group_name = "packer-temp"
}

build {
  sources = ["source.azure-arm.rocky"]

  provisioner "shell" {
    inline = [
      "sudo dnf update -y",
      "sudo dnf install epel-release -y"
    ]
  }
}
Step 7: Create a Variables File (variables.pkrvars.hcl)
client_id       = "xxxxxxxx-xxxx-xxxx-xxxx-xxxxxxxxxxxx"
client_secret   = "your-secret"
tenant_id       = "your-tenant-id"
subscription_id = "your-subscription-id"
Step 8: Run the Build
packer init .
packer build -var-file=variables.pkrvars.hcl .
Result
Your new custom Rocky Linux image will appear under your Azure resource group inside the Images section. From there, you can deploy it via the Azure Portal, CLI, Terraform, or ARM templates.
This process makes your infrastructure repeatable, versioned, and cloud-native. Use it to standardize dev environments or bake in security hardening from the start.
Automating Rocky Linux VM Creation with Packer + VirtualBox
If you’ve ever needed to spin up a clean, minimal Linux VM for testing or local automation — and got tired of clicking through the VirtualBox GUI — this guide is for you.
We’ll walk through how to use HashiCorp Packer and VirtualBox to automatically create a Rocky Linux 8.10 image, ready to boot and use — no Vagrant, no fluff.
What You’ll Need
- Packer installed
- VirtualBox installed
- Rocky Linux 8.10 ISO link (we use minimal)
- Basic understanding of Linux + VirtualBox
Project Structure
packer-rocky/
├── http/
│   └── ks.cfg       # Kickstart file for unattended install
├── rocky.pkr.hcl    # Main Packer config
Step 1: Create the Kickstart File (http/ks.cfg)
install
cdrom
lang en_US.UTF-8
keyboard us
network --bootproto=dhcp
rootpw packer
firewall --disabled
selinux --permissive
timezone UTC
bootloader --location=mbr
text
skipx
zerombr

# Partition disk
clearpart --all --initlabel
part /boot --fstype="xfs" --size=1024
part pv.01 --fstype="lvmpv" --grow
volgroup vg0 pv.01
logvol / --vgname=vg0 --fstype="xfs" --size=10240 --name=root
logvol swap --vgname=vg0 --size=4096 --name=swap

reboot

%packages --ignoremissing
@core
@base
%end

%post
# Post-install steps can be added here
%end
Step 2: Create the Packer HCL Template (rocky.pkr.hcl)
packer {
required_plugins {
virtualbox = {
version = ">= 1.0.5"
source = "github.com/hashicorp/virtualbox"
}
}
}
source "virtualbox-iso" "rocky" {
iso_url = "https://download.rockylinux.org/pub/rocky/8/isos/x86_64/Rocky-8.10-x86_64-minimal.iso"
iso_checksum = "2c735d3b0de921bd671a0e2d08461e3593ac84f64cdaef32e3ed56ba01f74f4b"
guest_os_type = "RedHat_64"
memory = 2048
cpus = 2
disk_size = 40000
vm_name = "rocky-8"
headless = false
guest_additions_mode = "disable"
boot_command = [" inst.text inst.ks=http://{{ .HTTPIP }}:{{ .HTTPPort }}/ks.cfg"]
http_directory = "http"
ssh_username = "root"
ssh_password = "packer"
ssh_timeout = "20m"
shutdown_command = "shutdown -P now"
vboxmanage = [
["modifyvm", "{{.Name}}", "--vram", "32"],
["modifyvm", "{{.Name}}", "--vrde", "off"],
["modifyvm", "{{.Name}}", "--ioapic", "off"],
["modifyvm", "{{.Name}}", "--pae", "off"],
["modifyvm", "{{.Name}}", "--nested-hw-virt", "on"]
]
}
build {
sources = ["source.virtualbox-iso.rocky"]
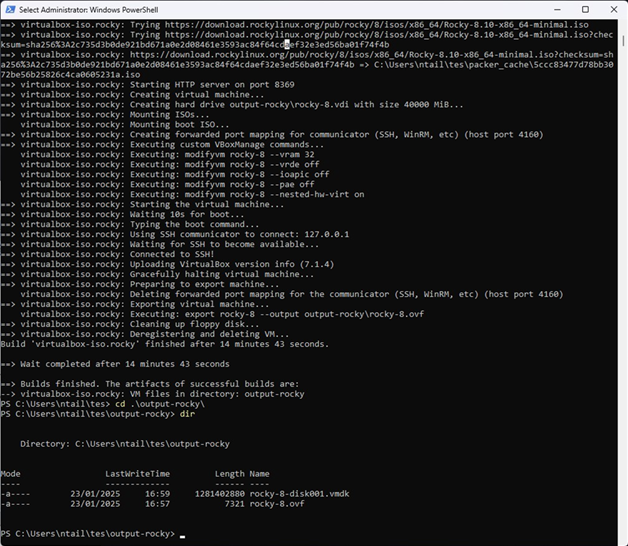
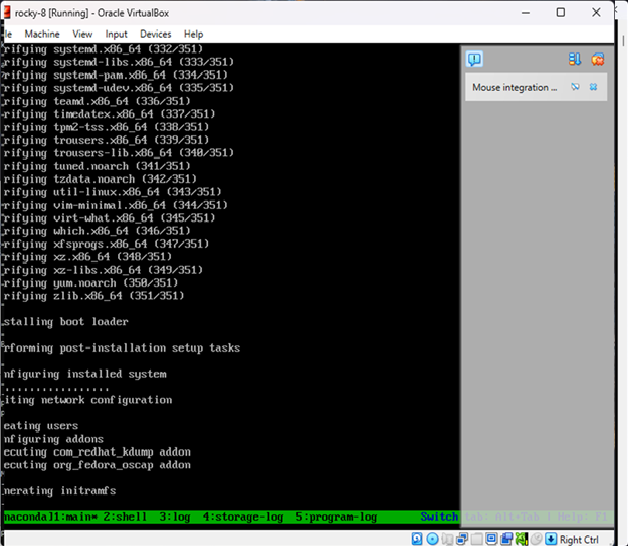
}Step 3: Run the Build
cd packer-rocky
packer init .
packer build .
Packer will:
- Download and boot the ISO in VirtualBox
- Serve the ks.cfg file over HTTP
- Automatically install Rocky Linux
- Power off the machine once complete
Result
You now have a fully installed Rocky Linux 8.10 image in VirtualBox — no manual setup required.
OpenShift Architecture & Migration Design: Building Secure, Scalable Enterprise Platforms
Designing and migrating to OpenShift is not about installing a cluster. It is about controlling failure domains, aligning schedulers, and avoiding hidden infrastructure bottlenecks that only surface under load or during outages.
This post walks through concrete implementation patterns using Terraform and Ansible, explains why they exist, and highlights what will break if you get them wrong.
Migration Strategy: Phased Approach
Every failed migration I have seen skipped or compressed one of these phases. The pressure to “just move it” creates technical debt that surfaces as production incidents.
Phase 1: Discovery and Assessment
Before touching infrastructure, you need a complete inventory of what exists and how it behaves.
# VMware dependency discovery script
# Export VM metadata, network connections, storage mappings

$vms = Get-VM | Select-Object Name, PowerState, NumCpu, MemoryGB,
  @{N='Datastore';E={(Get-Datastore -VM $_).Name}},
  @{N='Network';E={(Get-NetworkAdapter -VM $_).NetworkName}},
  @{N='VMHost';E={$_.VMHost.Name}}

$vms | Export-Csv -Path "vm-inventory.csv" -NoTypeInformation

# Capture network flows for dependency mapping
# Run for minimum 2 weeks to capture batch jobs and monthly processes
What you are looking for:
- Hard-coded IPs in application configs
- NFS mounts and shared storage dependencies
- Inter-VM communication patterns (what talks to what)
- Authentication integrations (LDAP, AD, service accounts)
- Scheduled jobs and their timing dependencies
Assessment deliverables:
- Application dependency map
- Containerization readiness score per workload
- Risk register with mitigation strategies
- Estimated effort per application (T-shirt sizing)
Phase 2: Target Architecture Design
Design the OpenShift environment before migration begins. This includes cluster topology, namespace strategy, and resource quotas.
# Namespace strategy example
# Environments separated by namespace, not cluster

apiVersion: v1
kind: Namespace
metadata:
  name: app-prod
  labels:
    environment: production
    cost-center: "12345"
    data-classification: confidential
---
apiVersion: v1
kind: ResourceQuota
metadata:
  name: app-prod-quota
  namespace: app-prod
spec:
  hard:
    requests.cpu: "40"
    requests.memory: 80Gi
    limits.cpu: "80"
    limits.memory: 160Gi
    persistentvolumeclaims: "20"
Phase 3: Pilot Migration
Select two to three non-critical applications that exercise different patterns:
- One stateless web application
- One application with persistent storage
- One application with external integrations
The pilot validates your tooling, processes, and assumptions before you scale.
Phase 4: Wave Migration
Group applications into waves based on dependencies and risk. Each wave should be independently deployable and rollback-capable.
# Wave planning structure
wave_1:
  applications:
    - name: static-website
      risk: low
      dependencies: none
      estimated_downtime: 0
  success_criteria:
    - all pods healthy for 24 hours
    - response times within 10% of baseline
    - zero error rate increase

wave_2:
  applications:
    - name: api-gateway
      risk: medium
      dependencies:
        - static-website
      estimated_downtime: 5 minutes
  gate:
    - wave_1 success criteria met
    - stakeholder sign-off
Phase 5: Cutover and Decommission
Final traffic switch and legacy teardown. This is where DNS TTL planning matters.
Common cutover failures:
- DNS TTLs not reduced in advance (reduce to 60 seconds, 48 hours before cutover)
- Client-side caching ignoring TTL
- Hardcoded IPs in partner systems
- Certificate mismatches after DNS change
VMware to OpenShift: Migration Patterns
Not every VM becomes a container. The migration pattern depends on application architecture, not convenience.
Pattern 1: Lift and Containerize
For applications that are already 12-factor compliant or close to it. Package existing binaries into containers with minimal modification.
# Dockerfile for legacy Java application
FROM registry.access.redhat.com/ubi8/openjdk-11-runtime

COPY target/app.jar /deployments/app.jar

ENV JAVA_OPTS="-Xms512m -Xmx2048m"

EXPOSE 8080
CMD ["java", "-jar", "/deployments/app.jar"]
When to use: Application reads config from environment variables, logs to stdout, and has no local state.
Pattern 2: Replatform with Refactoring
Application requires changes to run in containers but core logic remains. Typical changes include externalizing configuration and adding health endpoints.
# Spring Boot health endpoint addition
management:
  endpoints:
    web:
      exposure:
        include: health,info,prometheus
  endpoint:
    health:
      probes:
        enabled: true
      show-details: always
When to use: Application has some container-unfriendly patterns (file-based config, local logging) but is otherwise sound.
Pattern 3: Retain on VM
Some workloads should not be containerized:
- Legacy applications with kernel dependencies
- Workloads requiring specific hardware (GPU passthrough, SR-IOV)
- Applications with licensing tied to VM or physical host
- Databases with extreme I/O requirements (evaluate case by case)
OpenShift Virtualization (KubeVirt) can run VMs alongside containers when needed.
apiVersion: kubevirt.io/v1
kind: VirtualMachine
metadata:
  name: legacy-app-vm
spec:
  running: true
  template:
    spec:
      domain:
        cpu:
          cores: 4
        memory:
          guest: 8Gi
        devices:
          disks:
            - name: rootdisk
              disk:
                bus: virtio
      volumes:
        - name: rootdisk
          persistentVolumeClaim:
            claimName: legacy-app-pvc
Pattern 4: Rebuild or Replace
Application is fundamentally incompatible and would require complete rewrite. Evaluate whether a commercial off-the-shelf replacement makes more sense.
Decision matrix:
| Factor | Containerize | Keep on VM | Replace |
|---|---|---|---|
| Strategic value | High | Low/Legacy | Medium |
| Maintenance cost | Acceptable | High but stable | Unsustainable |
| 12-factor compliance | Partial or full | None | N/A |
| Vendor support | Available | Legacy only | N/A |
Infrastructure Provisioning with Terraform
Why Terraform First
OpenShift installation assumes the underlying infrastructure is deterministic. If VM placement, CPU topology, or networking varies between environments, the cluster will behave differently under identical workloads. Terraform is used to lock infrastructure intent before OpenShift ever runs.
Example: vSphere Control Plane and Worker Provisioning
provider "vsphere" {
  user           = var.vsphere_user
  password       = var.vsphere_password
  vsphere_server = var.vsphere_server
  allow_unverified_ssl = true
}

data "vsphere_datacenter" "dc" {
  name = var.datacenter
}

data "vsphere_compute_cluster" "cluster" {
  name          = var.cluster
  datacenter_id = data.vsphere_datacenter.dc.id
}

data "vsphere_datastore" "datastore" {
  name          = var.datastore
  datacenter_id = data.vsphere_datacenter.dc.id
}

data "vsphere_network" "network" {
  name          = var.network
  datacenter_id = data.vsphere_datacenter.dc.id
}

resource "vsphere_virtual_machine" "control_plane" {
  count            = 3
  name             = "ocp-master-${count.index}"
  resource_pool_id = data.vsphere_compute_cluster.cluster.resource_pool_id
  datastore_id     = data.vsphere_datastore.datastore.id
  folder           = var.vm_folder

  num_cpus = 8
  memory   = 32768
  guest_id = "rhel8_64Guest"

  # Critical: Reservations prevent resource contention
  cpu_reservation    = 8000
  memory_reservation = 32768

  # Anti-affinity rule reference
  depends_on = [vsphere_compute_cluster_vm_anti_affinity_rule.control_plane_anti_affinity]

  network_interface {
    network_id = data.vsphere_network.network.id
  }

  disk {
    label            = "root"
    size             = 120
    thin_provisioned = false  # Thick provisioning for control plane
  }

  disk {
    label            = "etcd"
    size             = 100
    thin_provisioned = false
    unit_number      = 1
  }
}

# Anti-affinity ensures control plane nodes run on different hosts
resource "vsphere_compute_cluster_vm_anti_affinity_rule" "control_plane_anti_affinity" {
  name               = "ocp-control-plane-anti-affinity"
  compute_cluster_id = data.vsphere_compute_cluster.cluster.id
  virtual_machine_ids = [for vm in vsphere_virtual_machine.control_plane : vm.id]
}
CPU and memory reservations are not optional. Without them, vSphere ballooning and scheduling delays will surface as random etcd latency and API instability.
What usually breaks:
- etcd timeouts under load (etcd requires consistent sub-10ms disk latency)
- API server flapping during node pressure
- Unexplained cluster degradation after vMotion events
- Split-brain scenarios when anti-affinity is not enforced
Worker Node Pools by Workload Type
resource "vsphere_virtual_machine" "workers_general" {
  count = 6
  name  = "ocp-worker-general-${count.index}"

  num_cpus = 8
  memory   = 32768

  # General workers can use thin provisioning
  disk {
    label            = "root"
    size             = 120
    thin_provisioned = true
  }
}

resource "vsphere_virtual_machine" "workers_stateful" {
  count = 3
  name  = "ocp-worker-stateful-${count.index}"

  num_cpus = 16
  memory   = 65536

  # Stateful workers need guaranteed resources
  cpu_reservation    = 16000
  memory_reservation = 65536

  disk {
    label            = "root"
    size             = 120
    thin_provisioned = false
  }
}

resource "vsphere_virtual_machine" "workers_infra" {
  count = 3
  name  = "ocp-worker-infra-${count.index}"

  num_cpus = 8
  memory   = 32768

  # Infrastructure nodes for routers, monitoring, logging
  disk {
    label            = "root"
    size             = 200
    thin_provisioned = false
  }
}
Different workloads require different failure and performance characteristics. Trying to “let Kubernetes figure it out” leads to noisy neighbors and unpredictable latency.
Post-Provision Configuration with Ansible
Why Ansible Is Still Required
Terraform stops at infrastructure. OpenShift nodes require OS-level hardening, kernel tuning, and configuration consistency before installation. Ignoring this step leads to subtle instability that manifests weeks later.
Example: Node OS Hardening
---
- name: Prepare OpenShift nodes
  hosts: openshift_nodes
  become: true
  tasks:

    - name: Disable swap
      command: swapoff -a
      changed_when: false

    - name: Remove swap from fstab
      replace:
        path: /etc/fstab
        regexp: '^([^#].*swap.*)$'
        replace: '# \1'

    - name: Set kernel parameters for OpenShift
      sysctl:
        name: "{{ item.key }}"
        value: "{{ item.value }}"
        state: present
        sysctl_file: /etc/sysctl.d/99-openshift.conf
      loop:
        - { key: net.ipv4.ip_forward, value: 1 }
        - { key: net.bridge.bridge-nf-call-iptables, value: 1 }
        - { key: net.bridge.bridge-nf-call-ip6tables, value: 1 }
        - { key: vm.max_map_count, value: 262144 }
        - { key: fs.inotify.max_user_watches, value: 1048576 }
        - { key: fs.inotify.max_user_instances, value: 8192 }
        - { key: net.core.somaxconn, value: 32768 }
        - { key: net.ipv4.tcp_max_syn_backlog, value: 32768 }

    - name: Load required kernel modules
      modprobe:
        name: "{{ item }}"
        state: present
      loop:
        - br_netfilter
        - overlay
        - ip_vs
        - ip_vs_rr
        - ip_vs_wrr
        - ip_vs_sh

    - name: Ensure kernel modules load on boot
      copy:
        dest: /etc/modules-load.d/openshift.conf
        content: |
          br_netfilter
          overlay
          ip_vs
          ip_vs_rr
          ip_vs_wrr
          ip_vs_sh
These values are not arbitrary. OpenShift components and container runtimes will fail silently or degrade under load if kernel defaults are used.
Container Runtime Configuration
- name: Configure CRI-O
  copy:
    dest: /etc/crio/crio.conf.d/99-custom.conf
    content: |
[crio.runtime]
default_ulimits = [ “nofile=1048576:1048576” ] pids_limit = 4096
[crio.image]
pause_image = “registry.redhat.io/openshift4/ose-pod:latest” – name: Configure container storage copy: dest: /etc/containers/storage.conf content: |
[storage]
driver = “overlay” runroot = “/run/containers/storage” graphroot = “/var/lib/containers/storage”
[storage.options.overlay]
mountopt = “nodev,metacopy=on”
Default ulimits are insufficient for high-density clusters. You will hit file descriptor exhaustion before CPU or memory limits.
Security Architecture
RBAC Design Principles
Role-based access control should follow least privilege. Avoid cluster-admin grants; use namespace-scoped roles.
# Developer role - namespace scoped
apiVersion: rbac.authorization.k8s.io/v1
kind: Role
metadata:
  name: developer
  namespace: app-dev
rules:
  - apiGroups: ["", "apps", "batch"]
    resources: ["pods", "deployments", "services", "configmaps", "secrets", "jobs", "cronjobs"]
    verbs: ["get", "list", "watch", "create", "update", "patch", "delete"]
  - apiGroups: [""]
    resources: ["pods/log", "pods/exec"]
    verbs: ["get", "create"]
  # Explicitly deny access to cluster resources
  - apiGroups: [""]
    resources: ["nodes", "persistentvolumes"]
    verbs: []
---
# Operations role - read-only cluster wide, write in specific namespaces
apiVersion: rbac.authorization.k8s.io/v1
kind: ClusterRole
metadata:
  name: operations-readonly
rules:
  - apiGroups: [""]
    resources: ["nodes", "namespaces", "persistentvolumes"]
    verbs: ["get", "list", "watch"]
  - apiGroups: [""]
    resources: ["pods", "services", "endpoints"]
    verbs: ["get", "list", "watch"]
Network Policies
Default deny with explicit allows. Every namespace should have a baseline policy.
# Default deny all ingress
apiVersion: networking.k8s.io/v1
kind: NetworkPolicy
metadata:
  name: default-deny-ingress
  namespace: app-prod
spec:
  podSelector: {}
  policyTypes:
    - Ingress
---
# Allow ingress from same namespace only
apiVersion: networking.k8s.io/v1
kind: NetworkPolicy
metadata:
  name: allow-same-namespace
  namespace: app-prod
spec:
  podSelector: {}
  policyTypes:
    - Ingress
  ingress:
    - from:
        - podSelector: {}
---
# Allow ingress from OpenShift router
apiVersion: networking.k8s.io/v1
kind: NetworkPolicy
metadata:
  name: allow-from-router
  namespace: app-prod
spec:
  podSelector:
    matchLabels:
      app: web-frontend
  policyTypes:
    - Ingress
  ingress:
    - from:
        - namespaceSelector:
            matchLabels:
              network.openshift.io/policy-group: ingress
Image Security and Supply Chain
# Image policy to restrict registries
apiVersion: config.openshift.io/v1
kind: Image
metadata:
  name: cluster
spec:
  registrySources:
    allowedRegistries:
      - registry.redhat.io
      - registry.access.redhat.com
      - quay.io
      - ghcr.io
      - registry.internal.example.com
    blockedRegistries:
      - docker.io  # Block Docker Hub for compliance
---
# Require signed images in production
apiVersion: policy.sigstore.dev/v1alpha1
kind: ClusterImagePolicy
metadata:
  name: require-signatures
spec:
  images:
    - glob: "registry.internal.example.com/prod/**"
  authorities:
    - keyless:
        url: https://fulcio.sigstore.dev
        identities:
          - issuer: https://accounts.google.com
            subject: release-team@example.com
Pod Security Standards
# Enforce restricted security context
apiVersion: v1
kind: Namespace
metadata:
  name: app-prod
  labels:
    pod-security.kubernetes.io/enforce: restricted
    pod-security.kubernetes.io/audit: restricted
    pod-security.kubernetes.io/warn: restricted
---
# Security Context Constraints for OpenShift
apiVersion: security.openshift.io/v1
kind: SecurityContextConstraints
metadata:
  name: app-restricted
allowPrivilegedContainer: false
allowPrivilegeEscalation: false
requiredDropCapabilities:
  - ALL
runAsUser:
  type: MustRunAsNonRoot
seLinuxContext:
  type: MustRunAs
fsGroup:
  type: MustRunAs
volumes:
  - configMap
  - emptyDir
  - projected
  - secret
  - downwardAPI
  - persistentVolumeClaim
Networking: Where Most Migrations Fail
Ingress and Load Balancer Alignment
External load balancers must align with OpenShift router expectations. Health checks should target readiness endpoints, not TCP ports.
# HAProxy configuration for OpenShift routers
frontend openshift_router_https
    bind *:443
    mode tcp
    option tcplog
    default_backend openshift_router_https_backend

backend openshift_router_https_backend
    mode tcp
    balance source
    option httpchk GET /healthz/ready HTTP/1.1\r\nHost:\ router-health
    http-check expect status 200
    server router-0 192.168.1.10:443 check port 1936 inter 5s fall 3 rise 2
    server router-1 192.168.1.11:443 check port 1936 inter 5s fall 3 rise 2
    server router-2 192.168.1.12:443 check port 1936 inter 5s fall 3 rise 2
Common failure: Load balancer marks routers healthy while the application is unavailable. TCP health checks pass even when the router pod is terminating.
MTU and Overlay Networking
MTU mismatches between underlay, NSX, and OpenShift overlays cause:
- Intermittent pod-to-pod packet loss
- gRPC failures (large payloads fragment incorrectly)
- Random CI/CD pipeline timeouts
- TLS handshake failures
# Verify MTU across the path
# Physical network: 9000 (jumbo frames)
# NSX overlay: 8900 (100 byte overhead)
# OpenShift OVN: 8800 (additional 100 byte overhead)

# Test from inside a pod
kubectl exec -it debug-pod -- ping -M do -s 8772 target-service

# If this fails, reduce MTU until it works
# Then configure cluster network appropriately
# OpenShift cluster network configuration
apiVersion: operator.openshift.io/v1
kind: Network
metadata:
  name: cluster
spec:
  clusterNetwork:
    - cidr: 10.128.0.0/14
      hostPrefix: 23
  serviceNetwork:
    - 172.30.0.0/16
  defaultNetwork:
    type: OVNKubernetes
    ovnKubernetesConfig:
      mtu: 8800
      genevePort: 6081
This is almost never diagnosed correctly on first pass. Symptoms look like application bugs.
DNS Configuration for Migration
# CoreDNS custom configuration for migration
apiVersion: v1
kind: ConfigMap
metadata:
  name: dns-custom
  namespace: openshift-dns
data:
  legacy.server: |
    legacy.example.com:53 {
      forward . 10.0.0.53 10.0.0.54
      cache 30
    }
During migration, pods may need to resolve legacy DNS names. Configure forwarding rules before cutting over applications.
Storage: Persistent Volumes and CSI Reality
StorageClass Design
# Pure Storage FlashArray - Fast tier
apiVersion: storage.k8s.io/v1
kind: StorageClass
metadata:
  name: pure-fast
  annotations:
    storageclass.kubernetes.io/is-default-class: "false"
provisioner: pure-csi
parameters:
  backend: flasharray
  csi.storage.k8s.io/fstype: xfs
  createoptions: -q
reclaimPolicy: Delete
volumeBindingMode: WaitForFirstConsumer
allowVolumeExpansion: true
---
# Pure Storage FlashBlade - Shared/NFS tier
apiVersion: storage.k8s.io/v1
kind: StorageClass
metadata:
  name: pure-shared
provisioner: pure-csi
parameters:
  backend: flashblade
  exportRules: "*(rw,no_root_squash)"
reclaimPolicy: Retain
volumeBindingMode: Immediate
---
# Standard tier for non-critical workloads
apiVersion: storage.k8s.io/v1
kind: StorageClass
metadata:
  name: standard
  annotations:
    storageclass.kubernetes.io/is-default-class: "true"
provisioner: kubernetes.io/vsphere-volume
parameters:
  diskformat: thin
  datastore: vsanDatastore
reclaimPolicy: Delete
volumeBindingMode: WaitForFirstConsumer
WaitForFirstConsumer is critical for block storage. Without it, volumes are bound before pod placement, breaking topology-aware scheduling.
What breaks if ignored:
- Pods stuck in Pending state
- Volumes attached to unreachable nodes
- Zone-aware deployments fail silently
Stateful Application Migration
# Database migration pattern using PVC cloning
apiVersion: v1
kind: PersistentVolumeClaim
metadata:
  name: db-data-migrated
spec:
  accessModes:
    - ReadWriteOnce
  storageClassName: pure-fast
  resources:
    requests:
      storage: 500Gi
  dataSource:
    kind: PersistentVolumeClaim
    name: db-data-legacy
Observability and Migration Validation
Baseline Metrics Before Migration
You cannot validate a migration without knowing what normal looks like. Capture baselines for at least two weeks before migration.
# Key metrics to baseline
# Application metrics
- request_duration_seconds (p50, p95, p99)
- request_total (rate)
- error_total (rate)
- active_connections

# Infrastructure metrics
- cpu_usage_percent
- memory_usage_bytes
- disk_io_seconds
- network_bytes_transmitted
- network_bytes_received

# Business metrics
- transactions_per_second
- successful_checkouts
- user_sessions_active
Prometheus Rules for Migration
apiVersion: monitoring.coreos.com/v1
kind: PrometheusRule
metadata:
  name: migration-validation
  namespace: openshift-monitoring
spec:
  groups:
    - name: migration.rules
      rules:
        # Alert if latency increases more than 20% post-migration
        - alert: MigrationLatencyRegression
          expr: |
            (
              histogram_quantile(0.95, sum(rate(http_request_duration_seconds_bucket{migrated="true"}[5m])) by (le, service))
              /
              histogram_quantile(0.95, sum(rate(http_request_duration_seconds_bucket{migrated="false"}[5m])) by (le, service))
            ) > 1.2
          for: 10m
          labels:
            severity: warning
          annotations:
            summary: "Latency regression detected post-migration"
            description: "Service {{ $labels.service }} p95 latency increased by more than 20%"

        # Alert on error rate increase
        - alert: MigrationErrorRateIncrease
          expr: |
            (
              sum(rate(http_requests_total{status=~"5..", migrated="true"}[5m])) by (service)
              /
              sum(rate(http_requests_total{migrated="true"}[5m])) by (service)
            ) > 0.01
          for: 5m
          labels:
            severity: critical
          annotations:
            summary: "Error rate exceeded 1% post-migration"
Grafana Dashboard for Migration
# Dashboard JSON snippet for migration comparison
{
  "panels": [
    {
      "title": "Request Latency Comparison",
      "type": "timeseries",
      "targets": [
        {
          "expr": "histogram_quantile(0.95, sum(rate(http_request_duration_seconds_bucket{env='legacy'}[5m])) by (le))",
          "legendFormat": "Legacy p95"
        },
        {
          "expr": "histogram_quantile(0.95, sum(rate(http_request_duration_seconds_bucket{env='openshift'}[5m])) by (le))",
          "legendFormat": "OpenShift p95"
        }
      ]
    },
    {
      "title": "Error Rate Comparison",
      "type": "stat",
      "targets": [
        {
          "expr": "sum(rate(http_requests_total{status=~'5..', env='openshift'}[5m])) / sum(rate(http_requests_total{env='openshift'}[5m]))",
          "legendFormat": "OpenShift Error Rate"
        }
      ]
    }
  ]
}
Log Aggregation for Troubleshooting
# Loki configuration for migration logs
apiVersion: loki.grafana.com/v1
kind: LokiStack
metadata:
  name: logging-loki
  namespace: openshift-logging
spec:
  size: 1x.small
  storage:
    schemas:
      - version: v12
        effectiveDate: "2024-01-01"
    secret:
      name: logging-loki-s3
      type: s3
  storageClassName: pure-fast
  tenants:
    mode: openshift-logging
CI/CD and GitOps: What Actually Works
Immutable Image Promotion
Do not rebuild images per environment. Build once, scan once, promote through environments.
# Tekton pipeline for build-once promotion
apiVersion: tekton.dev/v1beta1
kind: Pipeline
metadata:
  name: build-and-promote
spec:
  params:
    - name: git-revision
      type: string
  tasks:
    - name: build
      taskRef:
        name: buildah
      params:
        - name: IMAGE
          value: "registry.internal/app:$(params.git-revision)"

    - name: scan
      taskRef:
        name: trivy-scan
      runAfter:
        - build

    - name: sign
      taskRef:
        name: cosign-sign
      runAfter:
        - scan

    - name: promote-to-dev
      taskRef:
        name: skopeo-copy
      runAfter:
        - sign
      params:
        - name: srcImage
          value: "registry.internal/app:$(params.git-revision)"
        - name: destImage
          value: "registry.internal/app:dev"
If you rebuild per environment:
- Debugging becomes impossible (which build has the bug?)
- Security attestation is meaningless
- Promotion is not promotion, it is a new deployment
ArgoCD Application Example
apiVersion: argoproj.io/v1alpha1
kind: Application
metadata:
  name: app-prod
  namespace: openshift-gitops
spec:
  project: production
  destination:
    namespace: app-prod
    server: https://kubernetes.default.svc
  source:
    repoURL: https://github.com/org/app-config
    targetRevision: main
    path: overlays/prod
  syncPolicy:
    automated:
      prune: true
      selfHeal: true
    syncOptions:
      - CreateNamespace=false
      - PrunePropagationPolicy=foreground
      - PruneLast=true
  ignoreDifferences:
    - group: apps
      kind: Deployment
      jsonPointers:
        - /spec/replicas  # Allow HPA to control replicas
Self-heal is not optional in regulated or audited environments. Manual drift is operational debt that compounds.
Environment Promotion with Kustomize
# Base kustomization
# base/kustomization.yaml
apiVersion: kustomize.config.k8s.io/v1beta1
kind: Kustomization
resources:
  - deployment.yaml
  - service.yaml
  - configmap.yaml

# Production overlay
# overlays/prod/kustomization.yaml
apiVersion: kustomize.config.k8s.io/v1beta1
kind: Kustomization
resources:
  - ../../base
patches:
  - patch: |
      - op: replace
        path: /spec/replicas
        value: 5
    target:
      kind: Deployment
      name: app
images:
  - name: app
    newName: registry.internal/app
    newTag: v1.2.3  # Pinned version, updated by CI
Rollback Strategy
Application-Level Rollback
# ArgoCD rollback to previous version
argocd app history app-prod
argocd app rollback app-prod <revision>

# Or using kubectl
kubectl rollout undo deployment/app -n app-prod
kubectl rollout status deployment/app -n app-prod
Traffic-Based Rollback
# OpenShift route for blue-green deployment
apiVersion: route.openshift.io/v1
kind: Route
metadata:
  name: app
  namespace: app-prod
spec:
  to:
    kind: Service
    name: app-green
    weight: 100
  alternateBackends:
    - kind: Service
      name: app-blue
      weight: 0
---
# To rollback, shift traffic back to blue
# oc patch route app -p '{"spec":{"to":{"weight":0},"alternateBackends":[{"kind":"Service","name":"app-blue","weight":100}]}}'
Full Migration Rollback
For critical systems, maintain the ability to roll back the entire migration for a defined period.
# Rollback checklist
rollback_criteria:
  - error_rate > 5% for 15 minutes
  - p99_latency > 2x baseline for 30 minutes
  - data_integrity_check_failed
  - critical_integration_broken

rollback_procedure:
  1. Announce rollback decision
  2. Stop writes to new system (if applicable)
  3. Verify data sync to legacy is current
  4. Switch DNS/load balancer to legacy
  5. Verify legacy system health
  6. Communicate rollback complete
  7. Schedule post-mortem

rollback_window: 14 days  # Maintain legacy systems for 2 weeks post-migration
Data Rollback Considerations
# Continuous data sync for rollback capability
apiVersion: batch/v1
kind: CronJob
metadata:
  name: data-sync-to-legacy
spec:
  schedule: "*/5 * * * *"
  jobTemplate:
    spec:
      template:
        spec:
          containers:
            - name: sync
              image: registry.internal/data-sync:latest
              env:
                - name: SOURCE_DB
                  value: "postgresql://new-db:5432/app"
                - name: TARGET_DB
                  value: "postgresql://legacy-db:5432/app"
                - name: SYNC_MODE
                  value: "incremental"
          restartPolicy: OnFailure
Key principle: Never decommission legacy systems until the rollback window has passed and stakeholders have signed off.
Migration Execution: What People Underestimate
State and Cutover
Databases and stateful services require parallel runs and controlled traffic switching. DNS TTLs must be reduced days in advance, not minutes.
Most outages during migration are caused by:
- Hidden hard-coded IPs in application configs, scripts, and cron jobs
- Legacy authentication dependencies (service accounts with IP-based trust)
- Assumed local storage paths that do not exist in containers
- Timezone differences between legacy VMs and containers (UTC default)
- Environment variables that were set manually and never documented
Communication Plan
# Migration communication template
stakeholders:
  - business_owners
  - development_teams
  - operations
  - security
  - support

communications:
  - timing: T-14 days
    message: "Migration scheduled, review runbook"
    audience: all

  - timing: T-2 days
    message: "DNS TTL reduced, final validation"
    audience: operations, development

  - timing: T-0 (cutover)
    message: "Migration in progress, reduced SLA"
    audience: all

  - timing: T+1 hour
    message: "Initial validation complete"
    audience: all

  - timing: T+24 hours
    message: "Migration successful, monitoring continues"
    audience: all
Operational Testing (Non-Negotiable)
Before production:
- Kill a control plane node and verify automatic recovery
- Force etcd leader re-election during load
- Simulate storage controller failure
- Drain workers during peak load
- Test certificate rotation
- Verify backup and restore procedures
- Run security scan and penetration test
# Chaos testing example with Litmus
apiVersion: litmuschaos.io/v1alpha1
kind: ChaosEngine
metadata:
  name: control-plane-chaos
  namespace: litmus
spec:
  engineState: active
  appinfo:
    appns: openshift-etcd
    applabel: app=etcd
  chaosServiceAccount: litmus-admin
  experiments:
    - name: pod-delete
      spec:
        components:
          env:
            - name: TOTAL_CHAOS_DURATION
              value: "60"
            - name: CHAOS_INTERVAL
              value: "10"
            - name: FORCE
              value: "true"
If the platform team is afraid to do this, the cluster is not ready.
In short…
OpenShift migration is not a technology project. It is an operational transformation that happens to involve technology.
The patterns in this post exist because I have seen the alternatives fail. Every shortcut skipping reservations, ignoring kernel tuning, compressing testing phases creates debt that surfaces as production incidents.
Key principles:
- Infrastructure must be deterministic before OpenShift installation
- Security is architecture, not an afterthought
- Migration strategy matters more than migration speed
- Observability validates success; without baselines, you are guessing
- Rollback capability is not optional for production systems
- Test failure modes before they test you
The goal is not to move workloads. The goal is to move workloads without moving your problems with them and without creating new ones.
How to Deploy Kubernetes on AWS the Scalable Way
Kubernetes has become the de facto standard for orchestrating containerized workloads—but deploying it correctly on AWS requires more than just spinning up an EKS cluster. You need to think about scalability, cost-efficiency, security, and high availability from day one.
In this guide, we’ll walk you through how to deploy a scalable, production-grade Kubernetes environment on AWS—step by step.
Why Kubernetes on AWS?
Amazon Web Services offers powerful tools to run Kubernetes at scale, including:
- Amazon EKS – Fully managed control plane
- EC2 Auto Scaling Groups – Dynamic compute scaling
- Elastic Load Balancer (ELB) – Handles incoming traffic
- IAM Roles for Service Accounts – Fine-grained access control
- Fargate (Optional) – Run pods without managing servers
Step-by-Step Deployment Plan
1. Plan the Architecture
Your Kubernetes architecture should be:
- Highly Available (Multi-AZ)
- Scalable (Auto-scaling groups)
- Secure (Private networking, IAM roles)
- Observable (Monitoring, logging)
+---------------------+
|   Route 53 / ALB    |
+----------+----------+
           |
   +-------v-------+
   |  EKS Control   |
   |    Plane       |  <- Managed by AWS
   +-------+--------+
           |
+----------v----------+
|   EC2 Worker Nodes   |  <- Auto-scaling
|  (in Private Subnet) |
+----------+-----------+
           |
   +-------v--------+
   |  Kubernetes     |
   |  Workloads      |
   +-----------------+
2. Provision Infrastructure with IaC (Terraform)
Use Terraform to define your VPC, subnets, security groups, and EKS cluster:
module "eks" {
  source          = "terraform-aws-modules/eks/aws"
  cluster_name    = "my-cluster"
  cluster_version = "1.29"
  subnets         = module.vpc.private_subnets
  vpc_id          = module.vpc.vpc_id
  manage_aws_auth = true

  node_groups = {
    default = {
      desired_capacity = 3
      max_capacity     = 6
      min_capacity     = 1
      instance_type    = "t3.medium"
    }
  }
}
Security Tip: Keep worker nodes in private subnets and expose only your load balancer to the public internet.
3. Set Up Cluster Autoscaler
Install the Kubernetes Cluster Autoscaler to automatically scale your EC2 nodes:
kubectl apply -f cluster-autoscaler-autodiscover.yamlEnsure the autoscaler has IAM permissions via IRSA (IAM Roles for Service Accounts).
4. Use Horizontal Pod Autoscaler
Use HPA to scale pods based on resource usage:
apiVersion: autoscaling/v2
kind: HorizontalPodAutoscaler
metadata:
  name: myapp-hpa
spec:
  scaleTargetRef:
    apiVersion: apps/v1
    kind: Deployment
    name: myapp
  minReplicas: 2
  maxReplicas: 10
  metrics:
  - type: Resource
    resource:
      name: cpu
      target:
        type: Utilization
        averageUtilization: 70
5. Implement CI/CD Pipelines
Use tools like Argo CD, Flux, or GitHub Actions:
- name: Deploy to EKS
  uses: aws-actions/amazon-eks-deploy@v1
  with:
    cluster-name: my-cluster
    kubectl-version: '1.29'
6. Set Up Observability
Install:
- Prometheus + Grafana for metrics
- Fluent Bit or Loki for logging
- Kube-State-Metrics for cluster state
- AWS CloudTrail and GuardDuty for security monitoring
7. Optimize Costs
- Use Spot Instances with on-demand fallback
- Use EC2 Mixed Instance Policies
- Try Graviton (ARM) nodes for better cost-performance ratio
Bonus: Fargate Profiles for Microservices
For small or bursty workloads, use AWS Fargate to run pods serverlessly:
eksctl create fargateprofile \
  --cluster my-cluster \
  --name fp-default \
  --namespace default
Recap Checklist
- Multi-AZ VPC with private subnets
- Terraform-managed EKS cluster
- Cluster and pod auto-scaling enabled
- CI/CD pipeline in place
- Observability stack (metrics/logs/security)
- Spot instances or Fargate to save costs
Deploying Kubernetes on AWS at scale doesn’t have to be complex—but it does need a solid foundation. Use managed services where possible, automate everything, and focus on observability and security from the start.
If you’re looking for a production-grade, scalable deployment, Terraform + EKS + autoscaling is your winning combo.
Fixing Read-Only Mode on eLux Thin Clients
Fixing Read-Only Mode on eLux Thin Clients
If your eLux device boots into a read-only filesystem or prevents saving changes, it’s usually due to the write filter or system protection settings. Here’s how to identify and fix the issue.
Common Causes
- Write Filter is enabled (RAM overlay by default)
- System partition is locked as part of image protection
- Corrupted overlay from improper shutdown
Fix 1: Temporarily Remount as Read/Write
sudo mount -o remount,rw /This allows you to make temporary changes. They will be lost after reboot unless you adjust the image or profile settings.
Fix 2: Enable Persistent Mode via the EIS Tool
- Open your image project in the EIS Tool
- Go to the Settings tab
- Locate the write filter or storage persistence section
- Set it to Persistent Storage
- Export the updated image and redeploy
Fix 3: Enable Persistence via Scout Configuration Profile
- Open Scout Enterprise Console
- Go to Configuration > Profiles
- Edit the assigned profile
- Enable options like:
- Persistent user data
- Persistent certificate storage
- Persistent logging
- Save and reassign the profile
Fix 4: Reimage the Device
- If the system is damaged or stuck in read-only permanently, use a USB stick or PXE deployment to reflash the device.
- Ensure the new image has persistence enabled in the EIS Tool before deploying.
Check Filesystem Mount Status
mount | grep ' / 'If you see (ro) in the output, the system is in read-only mode.
Final Notes
- eLux protects system partitions by design — use Scout and EIS Tool to make lasting changes
- Remounting manually is fine for diagnostics but not a long-term fix
- Always test changes on a test device before rolling out to production
Elux Image Deployment
How to Create and Deploy a Custom eLux Image at Scale
This guide is intended for Linux/VDI system administrators managing eLux thin clients across enterprise environments. It covers:
- Part 1: Creating a fresh, customized eLux image
- Part 2: Deploying the image at scale using Scout Enterprise
Part 1: Creating a Custom eLux Image with Tailored Settings
Step 1: Download Required Files
- Go to https://www.myelux.com and log in.
- Download the following:
- Base OS image (e.g.,
elux-RP6-base.ufi) - Module files (
.ulc) – Citrix, VMware, Firefox, etc. - EIS Tool (eLux Image Stick Tool) for your admin OS
- Base OS image (e.g.,
Step 2: Install and Open the EIS Tool
- Install the EIS Tool on a Windows or Linux system.
- Launch the tool and click New Project.
- Select the downloaded
.ufibase image. - Name your project (e.g.,
elux-custom-v1) and confirm.
Step 3: Add or Remove Modules
- Go to the Modules tab inside the EIS Tool.
- Click Add and import the required
.ulcfiles. - Deselect any modules you don’t need.
- Click Apply to save module selections.
Step 4: Modify System Settings (Optional)
- Set default screen resolution
- Enable or disable write protection
- Choose RAM overlay or persistent storage
- Enable shell access if needed for support
- Disable unneeded services
Step 5: Export the Image
- To USB stick:
Click "Write to USB Stick" Select your USB target drive - To file for network deployment:
Click "Export Image"
Save your customized .ufi (e.g., elux-custom-v1.ufi)
Part 2: Deploying the Custom Image at Scale Using Scout Enterprise
Step 1: Import the Image into Scout
- Open Scout Enterprise Console
- Navigate to Repository > Images
- Right-click → Import Image
- Select the
.ufifile created earlier
Step 2: Create and Configure a Profile
- Go to Configuration > Profiles
- Click New Profile
- Configure network, session, and UI settings
- Save and name the profile (e.g.,
Citrix-Kiosk-Profile)
Step 3: Assign Image and Profile to Devices or Groups
- Navigate to Devices or Groups
- Right-click → Assign OS Image
- Select your custom
.ufi - Right-click → Assign Profile
- Select your configuration profile
Step 4: Deploy the Image
Option A: PXE Network Deployment
- Enable PXE boot on client devices (via BIOS)
- Ensure PXE services are running (Scout or custom)
- On reboot, clients auto-deploy image and config
Option B: USB Stick Installation
- Boot client device from prepared USB stick
- Follow on-screen instructions to install
- Device registers and pulls config from Scout
Step 5: Monitor Deployment
- Use Logs > Job Queue to track installations
- Search for devices to confirm version and status
Optional Commands
Inspect or Write Images
# Mount .ufi image (read-only)
sudo mount -o loop elux-custom.ufi /mnt/elux

# Write image to USB on Linux
sudo dd if=elux-custom.ufi of=/dev/sdX bs=4M status=progress
Manual PXE Server Setup (Linux)
sudo apt install tftpd-hpa dnsmasq

# Example dnsmasq.conf
port=0
interface=eth0
dhcp-range=192.168.1.100,192.168.1.200,12h
dhcp-boot=pxelinux.0
enable-tftp
tftp-root=/srv/tftp

sudo systemctl restart tftpd-hpa
dsudo systemctl restart dnsmasq
Commands on eLux Device Shell
# Switch to shell (Ctrl+Alt+F1), then:
uname -a
df -h
scout showconfig
scout pullconfig
Summary
| Task | Tool |
|---|---|
| Build custom image | EIS Tool |
| Add/remove software modules | .ulc files + EIS Tool |
| Customize settings | EIS Tool + Scout Profile |
| Deploy to all clients | PXE boot or USB + Scout |
| Manage and monitor at scale | Scout Enterprise Console |
How to Deploy Lustre with ZFS Backend (RDMA, ACLs, Nodemaps, Clients
This step-by-step guide walks you through deploying a production-ready Lustre filesystem backed by ZFS, including RDMA networking, MDT/OST setup, nodemaps, ACL configuration, and client mounting. This guide assumes:
- MGS + MDS on one node
- One or more OSS nodes
- Clients mounting over RDMA (o2ib)
- ZFS as the backend filesystem
0. Architecture & Assumptions
- Filesystem name: lustrefs
- MGS/MDS RDMA IP: 172.16.0.10
- OSS RDMA IP: 172.16.0.20
- Client RDMA IP: 172.16.0.30
- RDMA interface: ib0
- Network type: o2ib
1. Manager Server Setup (MGS + MDS with ZFS)
1.1 Install ZFS and Lustre MDS packages
sudo apt update
sudo apt install -y zfsutils-linux
sudo apt install -y lustre-osd-zfs-mount lustre-utils
1.2 Create a ZFS pool for MDT
sudo zpool create mdtpool mirror /dev/nvme0n1 /dev/nvme1n1 ashift=12
sudo zfs create -o recordsize=4K -o primarycache=metadata mdtpool/mdt0
1.3 Format MDT & enable MGS
sudo mkfs.lustre \
  --fsname=lustrefs \
  --mgs \
  --mdt \
  --index=0 \
  --backfstype=zfs mdtpool/mdt0
1.4 Mount MDT
sudo mkdir -p /mnt/mdt0
sudo mount -t lustre mdtpool/mdt0 /mnt/mdt0
2. RDMA + LNET Configuration (All Nodes)
2.1 Install RDMA core utilities
sudo apt install -y rdma-core
2.2 Bring up the RDMA interface
sudo ip addr add 172.16.0.10/24 dev ib0
sudo ip link set ib0 up
2.3 Configure LNET to use o2ib
Create /etc/modprobe.d/lustre.conf:
options lnet networks="o2ib(ib0)"
Load and enable LNET
sudo modprobe lnet
sudo systemctl enable lnet
sudo systemctl start lnet
sudo lctl list_nids
3. OFED / Mellanox Optional Performance Tuning
These settings are optional but recommended for high-performance Lustre deployments using Mellanox or OFED-based InfiniBand hardware.
3.1 Relevant config locations
/etc/infiniband/*/etc/modprobe.d/mlx5.conf/etc/security/limits.d/rdma.conf/etc/sysctl.conf(MTU, hugepages, buffers)/etc/rdma/modules/
3.2 Increase RDMA MTU (InfiniBand)
sudo ip link set ib0 mtu 65520
3.3 Increase RDMA network buffers
echo 262144 | sudo tee /proc/sys/net/core/rmem_max
echo 262144 | sudo tee /proc/sys/net/core/wmem_max
These settings improve performance when using high-speed links (56Gb, 100Gb, HDR100, etc.).
4. OSS Node Setup (ZFS + OSTs)
4.1 Install ZFS + Lustre OSS components
sudo apt update
sudo apt install -y zfsutils-linux lustre-osd-zfs-mount lustre-utils
4.2 Create an OST ZFS pool
sudo zpool create ostpool raidz2 \
    /dev/sdc /dev/sdd /dev/sde /dev/sdf ashift=12

sudo zfs create -o recordsize=1M ostpool/ost0
4.3 Format OST using RDMA to MGS
sudo mkfs.lustre \
  --fsname=lustrefs \
  --ost \
  --index=0 \
  --mgsnode=172.16.0.10@o2ib \
  --backfstype=zfs ostpool/ost0
4.4 Mount OST
sudo mkdir -p /mnt/ost0
sudo mount -t lustre ostpool/ost0 /mnt/ost0
5. Client Node Setup
5.1 Install Lustre client packages
sudo apt update
sudo apt install -y lustre-client-modules-$(uname -r) lustre-utils
If you setup MGS/OSS and client correctly when you mount from the client
5.2 Configure RDMA + LNET (same as above)
sudo ip addr add 172.16.0.30/24 dev ib0
sudo ip link set ib0 up

echo 'options lnet networks="o2ib(ib0)"' | sudo tee /etc/modprobe.d/lustre.conf

sudo modprobe lnet
sudo systemctl start lnet
sudo lctl list_nids
6. How to Get Lustre Target Names
List OSTs
lfs osts
List MDTs
lfs mdts
List all targets and connections
lctl dl
Check space and OST availability
lfs df -h
7. Nodemap Configuration (Access Control)
7.1 Create and enable default nodemap
sudo lctl nodemap_add default
sudo lctl nodemap_modify default --property enable=1
sudo lctl nodemap_modify default --property map_mode=identity
7.2 Restrict access to an RDMA subnet
sudo lctl nodemap_modify default --add ranges=172.16.0.0@o2ib/24
7.3 Make a subnet read-only (optional)
sudo lctl nodemap_modify default --property readonly=true
8. ACL Configuration (ZFS + Lustre)
8.1 Enable ACL support in ZFS (MDT)
sudo zfs set acltype=posixacl mdtpool/mdt0
sudo zfs set xattr=sa mdtpool/mdt0
sudo zfs set compression=off mdtpool/mdt0
8.2 Enable ACLs in Lustre
sudo lctl set_param mdt.*.enable_acls=1
8.3 Use ACLs from clients
sudo setfacl -m u:alice:rwx /mnt/lustre/data
getfacl /mnt/lustre/data
9. Mounting Lustre on Clients (Over RDMA)
9.1 Mount command
sudo mkdir -p /mnt/lustre

sudo mount -t lustre \
  172.16.0.10@o2ib:/lustrefs \
  /mnt/lustre

example without ibnetwork
[root@vbox ~]# mount -t lustre 192.168.50.5@tcp:/lustre /mnt/lustre-client
[root@vbox ~]#
[root@vbox ~]# # Verify the mount worked
[root@vbox ~]# df -h /mnt/lustre-client
Filesystem                Size  Used Avail Use% Mounted on
192.168.50.5@tcp:/lustre   12G  2.5M   11G   1% /mnt/lustre-client
[root@vbox ~]# lfs df -h
UUID                       bytes        Used   Available Use% Mounted on
lustre-MDT0000_UUID         4.5G        1.9M        4.1G   1% /mnt/lustre-client[MDT:0]
lustre-OST0000_UUID         7.5G        1.2M        7.0G   1% /mnt/lustre-client[OST:0]
lustre-OST0001_UUID         3.9G        1.2M        3.7G   1% /mnt/lustre-client[OST:1]
filesystem_summary:        11.4G        2.4M       10.7G   1% /mnt/lustre-client
9.2 Verify the mount
df -h /mnt/lustre
lfs df -h
9.3 Persistent fstab entry
172.16.0.10@o2ib:/lustrefs /mnt/lustre lustre _netdev,defaults 0 0
10. Summary of the Correct Order
- Install ZFS + Lustre on MGS/MDS
- Create MDT ZFS dataset & format MDT+MGS
- Configure RDMA + LNET
- Apply optional OFED/Mellanox tuning
- Install ZFS + Lustre on OSS, create OSTs
- Format and mount OSTs
- Install Lustre client packages
- Mount client via RDMA
- Retrieve target names (OST/MDT)
- Configure nodemaps
- Configure ACLs
Final Notes
You now have a complete ZFS-backed Lustre filesystem with RDMA transport, OFED/Mellanox tunings, ACLs, and nodemaps. This layout provides parallel filesystem HIGH grade performance and clean scalability.
Note: I have also created a ansible-playbook that can deploy this across clients and test everything; its currently not a public repo; email me at support@nicktailor.com. If you like to hire me to set it up.
├── inventory/
│ └── hosts.yml # Inventory file with host definitions
├── group_vars/
│ └── all.yml # Global variables
├── roles/
│ ├── infiniband/ # InfiniBand/RDMA setup
│ ├── zfs/ # ZFS installation and configuration
│ ├── lustre_mgs_mds/ # MGS/MDS server setup
│ ├── lustre_oss/ # OSS server setup
│ ├── lustre_client/ # Client setup
│ ├── lustre_nodemaps/ # Nodemap configuration
│ └── lustre_acls/ # ACL configuration
├── site.yml # Main deployment playbook
├── test_connectivity.yml # Connectivity testing playbook
└── README.md # This file